

Based on casual conversations with acquaintances and strangers both within and outside the police force and as part of my field work and outside it, I gathered that the general belief in India is that Muslims are more likely to commit crime than other communities.
In these conversations, I said very little myself, because as a researcher, I am wary of making claims or counterclaims without evidence. Since numbers speak louder than name-callings, I went on to explore the possibility of finding data to either buttress or violate this general impression. Though conclusive research is ongoing, I feel compelled to share my preliminary findings at this very stage.
Statistics and bias?
The National Crime Records Bureau (NCRB) data of convicts across 19 states over the period 1998-2015 revealed something striking.
In almost all the states of India, the Muslim community consistently comprised a larger proportion of total convicts vis-à-vis their proportion in population, unlike the Hindu community (figure 1 below).
This relative disproportionality was especially stark in Uttarakhand, Rajasthan, Maharashtra, West Bengal and Gujarat. For instance, looking at the maximum percentages that Muslim convicts can take over the studied time period, Muslims comprised approximately 11.9%, 9.2%, 11.54%, 26.35%, 8.83% respectively of the population in each of the aforementioned states, but comprised approximately 22.8%, 19.2%, 31.6%, 52.8%, 28.8% of the convicts in these states.
Does this mean that the general belief holds true? On the face of it, perhaps. But on pondering a little further and daring to question some of the nuts and bolts of the criminal justice system itself, I found myself wondering if it is not the statistics that generate the belief, but the belief that generates the statistics.
The possibility of the latter seems to be suggested in the Status of Policing in India Report (SPIR) of 2019, which categorically mentions that the data its researchers collected found that police personnel seem to hold a significant bias against Muslims.
In fact, when I compared the SPIR data on bias with my own calculations from the NCRB data, I found that Uttarakhand and Maharashtra figure among the top states in terms of the belief of police personnel respondents that the minority community is “naturally prone to committing crimes”. Rajasthan and West Bengal are only one percentage point behind Uttarakhand in terms of police personnel who hold such a bias.
Figure 1: Muslim convicts constitute a larger percentage of total convicts vis-à-vis their population percentage
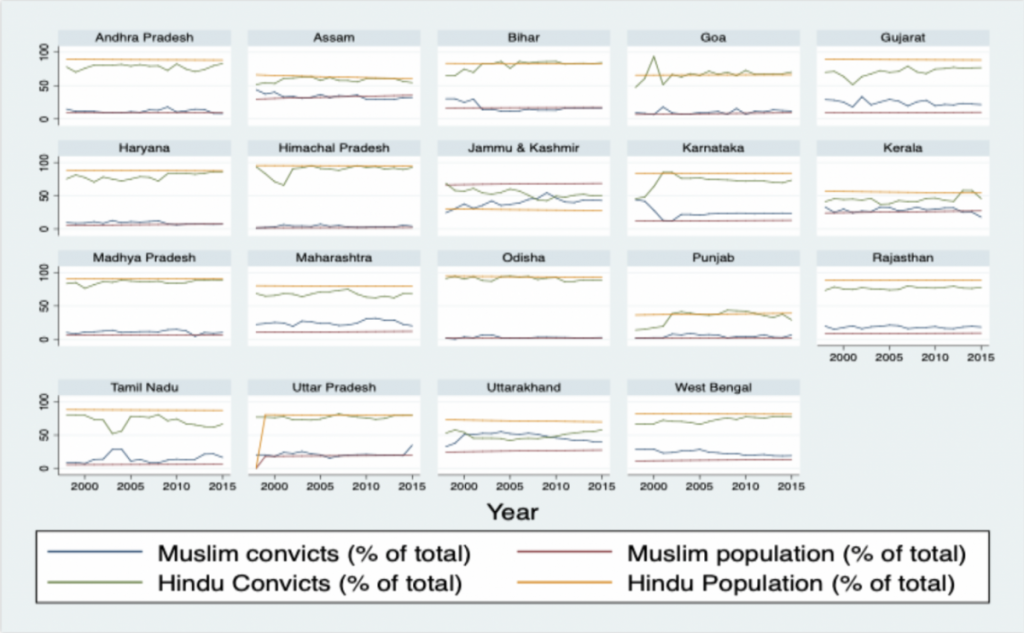
Source: Author’s calculations
Seeking causality
Since there are many layers in the criminal justice system and police investigation reports are just one aspect of them, these preliminary findings cannot be considered adequate enough to say whether bias on the part of police personnel may indirectly lead to a disproportionately higher percentage of convicts from the minority.
The conventional approach when studying determinants of criminal behaviour is to enquire into possible disadvantages in terms of education and employment status. The Sachar Committee report did hint at such disadvantages being suffered by the minority. But then, the Sachar Committee also found a lack of representation of the minority community in the police forces. So to assess which one of these factors (if at all) actually causes the disproportionality among convicts requires much deeper engagement.
I ran a simple OLS (Ordinary Least Squares) regression (an econometrics tool) that assessed the impact of socioeconomic and political factors on the ratio of Muslim to Hindu convicts. These factors included:
- Muslim poverty relative to Hindu (both urban and rural), data for which was taken from a 2005 study by economists Rijo M. John and Rohit Mutatkar;
- The Muslim unemployment rate relative to Hindu (both urban and rural), data for which was taken from the National Sample Survey Office report titled Employment and Unemployment Situation among Major Religious Groups in India and published in 2009 and 2011; and
iii. Muslim education levels relative to Hindu, specifically in the completion of senior secondary education and in terms of diploma-holders, data for which was taken from the Census of India 2001 and 2011.
The control variable in the OLS regression was the Muslim population relative to the Hindu population, data for which I took from the Census of India 2001 and 2011.
An important and interesting explanatory variable in such an analysis is the extent of political or judicial power that a particular religion or caste enjoys. While judicial power cannot be quantified due to data unavailability, political power can be gauged from legislative assembly data, specifically the percentage of State Legislative Assembly seats won by Muslims, which is available at the Election Commission of India.
All the explanatory variables and the control variable were interpolated in my OLS regression as they were not available for all the years.
The preliminary results of the regression test are seen in Table 1. The test revealed that the number of Muslim convicts relative to Hindu is adversely affected or increased by the higher relative rural poverty and urban unemployment of the minority, but favourably affected or decreased by the higher relative education indicators of the minority. Furthermore, when a higher percentage of state legislative assembly seats are occupied by the minority community, their relative conviction is lower.
Table 1: Regression Results
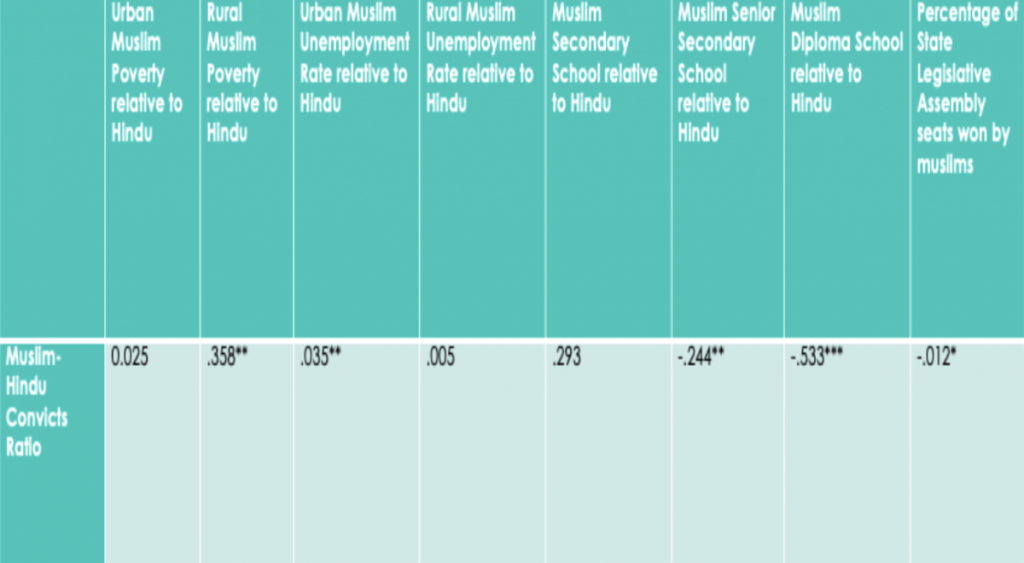
These results do not claim causality. But the fact that such disproportionality in conviction exists and that there seems to be some relation to socioeconomic and political disadvantages, and also possibly bias held by law enforcement personnel, cannot and must not be overlooked.
A double whammy?
What came to mind next was the possibility of a flip side to this question. Muslims are apparently more vulnerable to falling on the wrong side of the law. But given the many disadvantages they face, as seen earlier, are they also more vulnerable to crime – specifically in this case, violence – than Hindus?
To study this I obtained data from the India Human Development Survey-II, a nationally-representative household survey conducted by scholars from the University of Maryland, the US National Council of Applied Economic Research, Indiana University, and the University of Michigan.
After collating the data to the district level, I based the variable to capture vulnerability to violence on “whether anyone in the household has been threatened or attacked in the last 12 months”.
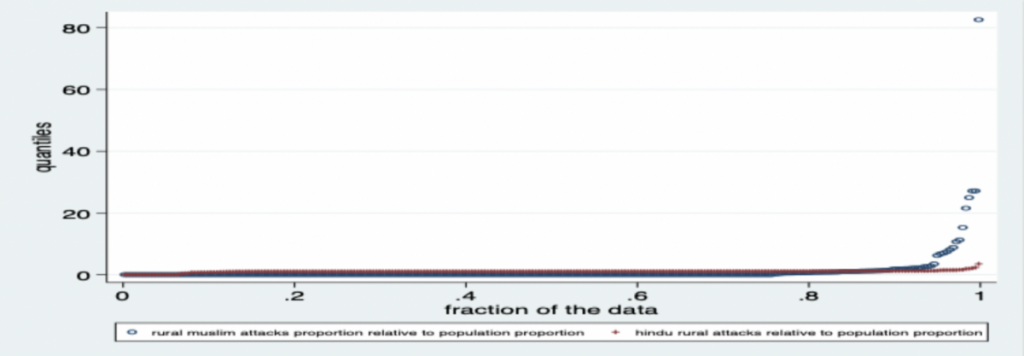
It seems that when Muslims comprise a higher population proportion, their vulnerability increases in urban areas. But this is not the case in rural areas (figures 2 and 3). Again, these are only preliminary findings and further analysis could throw more light on the issue.
But it should be noted that economists Anirban Mitra and Debraj Ray, in their study ‘Implications of an Economic Theory of Conflict: Hindu-Muslim Violence in India’ published in the Journal of Political Economy in 2014, do point out that in most studies on Hindu-Muslim violence in India, Muslims seem to suffer disproportionately more relative to their population.
Figure 2: Relative Vulnerability in Urban Areas (Proportion of attacks reported by a community relative to its population proportion)
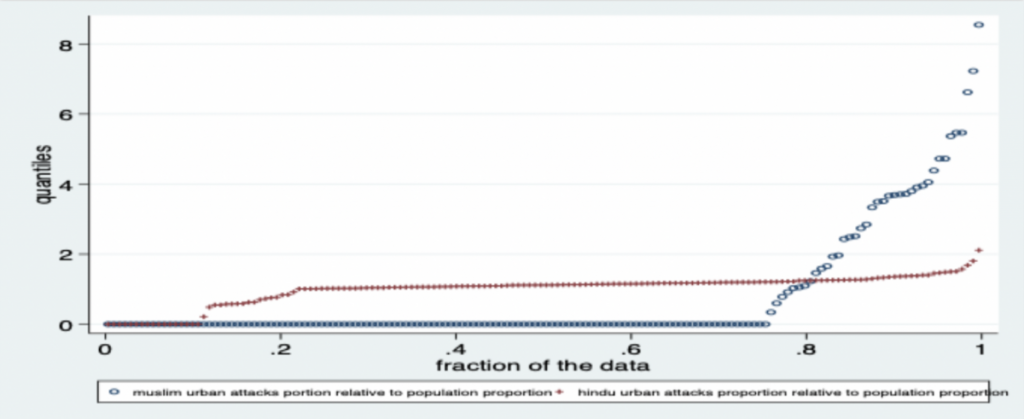
Figure 3: Relative Vulnerability in Rural Areas (Proportion of attacks reported by a community relative to its population proportion)
The possibility of a double whammy for the minority community in terms of higher vulnerability on both the offender and victim sides of violence thus seems apparent. However, a more elaborate analysis is required to ascertain the nature, extent and causes for this, while accounting for state and district-level heterogeneity.
This article was first published on The Wire by Written by Malvika Tyagi And Illustration by Pariplab Chakraborty
Malvika Tyagi is affiliate faculty at the Department of Economics, George Mason University.